Before satellite technologies were available, impervious surface was often calculated by assigning average percent impervious values to land use classes that had been developed from parcel maps or interpreted from aerial photography. For example, single family residential would be classified as 35% impervious, commercial as 85% impervious, industrial as 75% impervious, and parks as 15% impervious. However, the average values may not accurately represent any particular location due to building and design variations, and it was often expensive to obtain the land use data. Further, when results are needed over larger geographic regions, (e.g., multiple cities) there are likely differences in methods and dates of data collection that lead to inconsistencies in comparisons over time and location.
Zero to 100 -- Digitally
Recently researchers at several universities, including the University of Minnesota, have investigated the potential of satellite remote sensing as a means to accurately and economically map impervious surface area. The results demonstrate that digital multispectral satellite imagery can be used to accurately determine and map the amount of impervious surface area. The methods depict the degree of imperviousness from 0 to 100% at the pixel level - 30 meters on a side or about 1/4-acre for Landsat Thematic Mapper (TM) data. Finer resolution maps can also be generated using higher resolution satellite data.
How "green" is your pixel?
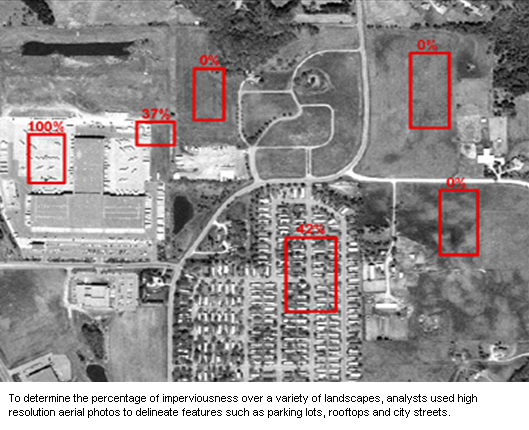
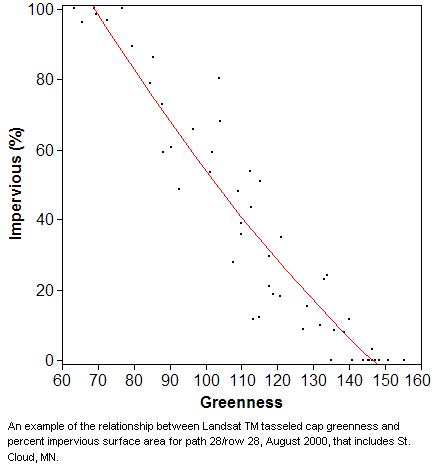
The method is based on a strong relationship of the "greenness" component of the "tasseled cap" transformation of Landsat TM data to the amount of green vegetation, and therefore to the lack of green vegetation, or impervious surfaces, in a pixel (1/4-acre cells). Although the majority of Landsat pixels in an urban area are mixtures of two or more cover types, this method provides a means to estimate the fraction of each pixel that is impervious. Following conversion of the six reflective spectral bands of the Landsat data to greenness, a polynomial regression model of the relationship of greenness to percent impervious area is developed based on measurements from high resolution digital orthophotos for a random sample of approximately 50 sites with varying amounts and kinds of imperviousness and vegetation. Once the regression model is developed representing different kinds and amounts of impervious, it is applied to all of the pixels in the landsat image that have been classified as urban or developed.
Consistent Results
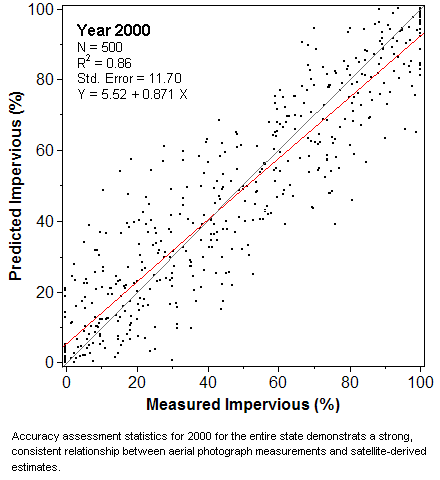
A comparison of measurements from an independent set of samples to the Landsat estimates of the amount of impervious area is shown for the entire state for the 2000 impervious surface classification. The accuracy or agreement between the Landsat estimates and measurements from the aerial photography has been high - with average accuracy of ~90% (as measured by R2) and standard errors of 8 - 11%.)
The strong relationship of greenness to percent impervious surface area enables accurately classifying or mapping the degree of imperviousness for large areas. Impervious maps of the Twin Cities Metropolitan Area have been generated for 1986, 1992, 1998 and 2002 and the entire state of Minnesota has been classified for ~1990 and ~2000.
Once the maps are created, we can look more closely at areas that are experiencing a significant amount of growth, derive watershed, county and city-level statistics, and determine areas of emerging increasing imperviousness that can still be mitigated by local and regional policy makers to minimize impacts on the surrounding watershed systems.


